Codes Into the Light
The Birth of Spectroscopy
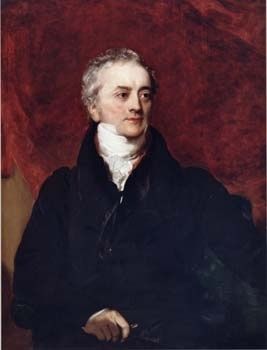
In 1801, the physicist Thomas Young clearly demonstrated that light travels as a wave, much like the succession of crests and troughs along the surface of water. The concept was not new – the Dutch physicist Christiaan Huygens had already proposed this idea during Newton’s time – yet Young was able to convince the scientific community by studying the patterns made by a beam of light as it passed through slits.
One of Young’s most astonishing feats was that he succeeded in measuring the wavelengths of red and violet light; that is, the distance between two crests or troughs of successive waves. His results revealed a wavelength of 7 thousandths of a millimetre for red light and 4 thousandths of a millimetre for violet. Combining these measurements with the basic concepts of Newton’s work, he concluded that light with a longer wavelength is less deflected than light with a shorter wavelength.
During the same historic period, around 1802, the British chemist William Hyde Wollaston uncovered a surprising fact: the spectrum of sunlight is not continuous. In fact, numerous black lines are superimposed on the colours of its spectrum. Unfortunately, this revelation did not attract much attention and no ideas were advanced to explain their presence.

Several years later, in 1814, the German optician Josef von Fraunhofer noticed the same black lines in the spectrum of sunlight. Although he did not understand their significance, he nonetheless measured their positions and catalogued a total of 324.
In 1859, the German chemist Robert Wilhelm Bunsen (who improved and popularized the burner that bears his name) devised an original analytical technique: he inserted mineral salts into the flame of his burner and observed the colours produced by the gas emitted. He was thus able to determine whether a particular substance was present in a mineral by observing a colour that, according to him, characterized that substance.
Gustav Robert Kirchhoff, a German physician and friend of Bunsen, proposed the additional step of dispersing the light emitted by the gas by using a prism. In this way, they would be able to study its spectra. The two researchers thus made a major discovery: each chemical element generates a series of spectral rays that uniquely characterize the substance, much like a fingerprint identifies a person.
The invention of tTheir new analytical technique, spectroscopy, led to the discovery of many new chemical elements in the years ahead.
Kirchhoff was interested in the spectrum of sunlight and realized that Fraunhofer’s black lines corresponded exactly to the bright rays emitted by specific chemical elements. He deduced that the white light produced by the hot surface of the Sun was in part absorbed by certain chemical elements present in its cooler atmosphere, which produces black lines in the spectrum.
Pursuing this line of research, Kirchhoff deduced the existence of three types of spectra:
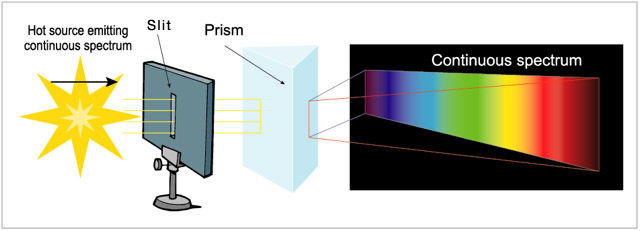
The continuous spectrum, produced by a solid or a hot opaque gas. It displays a continuous spread of colour from red to violet. For example, iron heated until it turns white would produce a continuous spectrum, as would the hot surface of a star with very little or no atmosphere (some white dwarf suns as well as pulsars, the leftovers from supernovas, would fall into this category).
The emission spectrum, produced by all hot and transparent gases. It consists of straight bright lines on a black background, with the bright lines being characteristic of the chemical elements in the gas. Emission spectra are produced by gases in everything from a gas burner to a nebula (a nebula can be thought of as a fairly hot cloud of gas and dust).
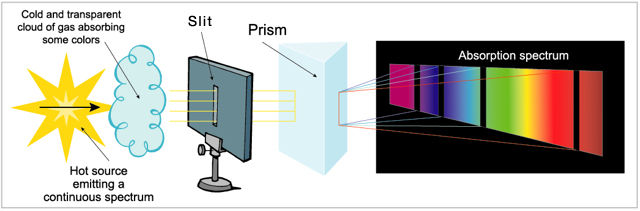
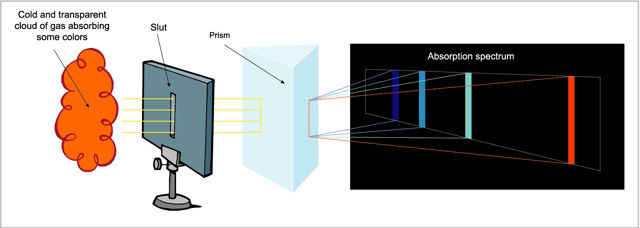
The absorption spectrum, produced when a transparent and relatively cool gas absorbs part of the light in the continuous spectrum of a hotter source. It appears as a series of black lines superimposed on the continuous spectrum, with the black lines corresponding to the composition of the chemical elements in the cooler gas.
Kirchhoff’s discoveries opened the doors to spectroscopic studies in astronomy. To their great satisfaction, astronomers were now equipped with a method for determining the chemical composition of stars and nebulas, and even their temperature, distance, speed and age by measuring the intensity of the different spectral rays and applying basic principles of physics. It was through spectroscopy that light allowed us to “touch the stars”, something long believed impossible due to the great distances involved.
One problem remained unanswered for Kirchhoff: he could not explain how matter could emit or absorb light. Other researchers would help resolve this enigma 50 years later.